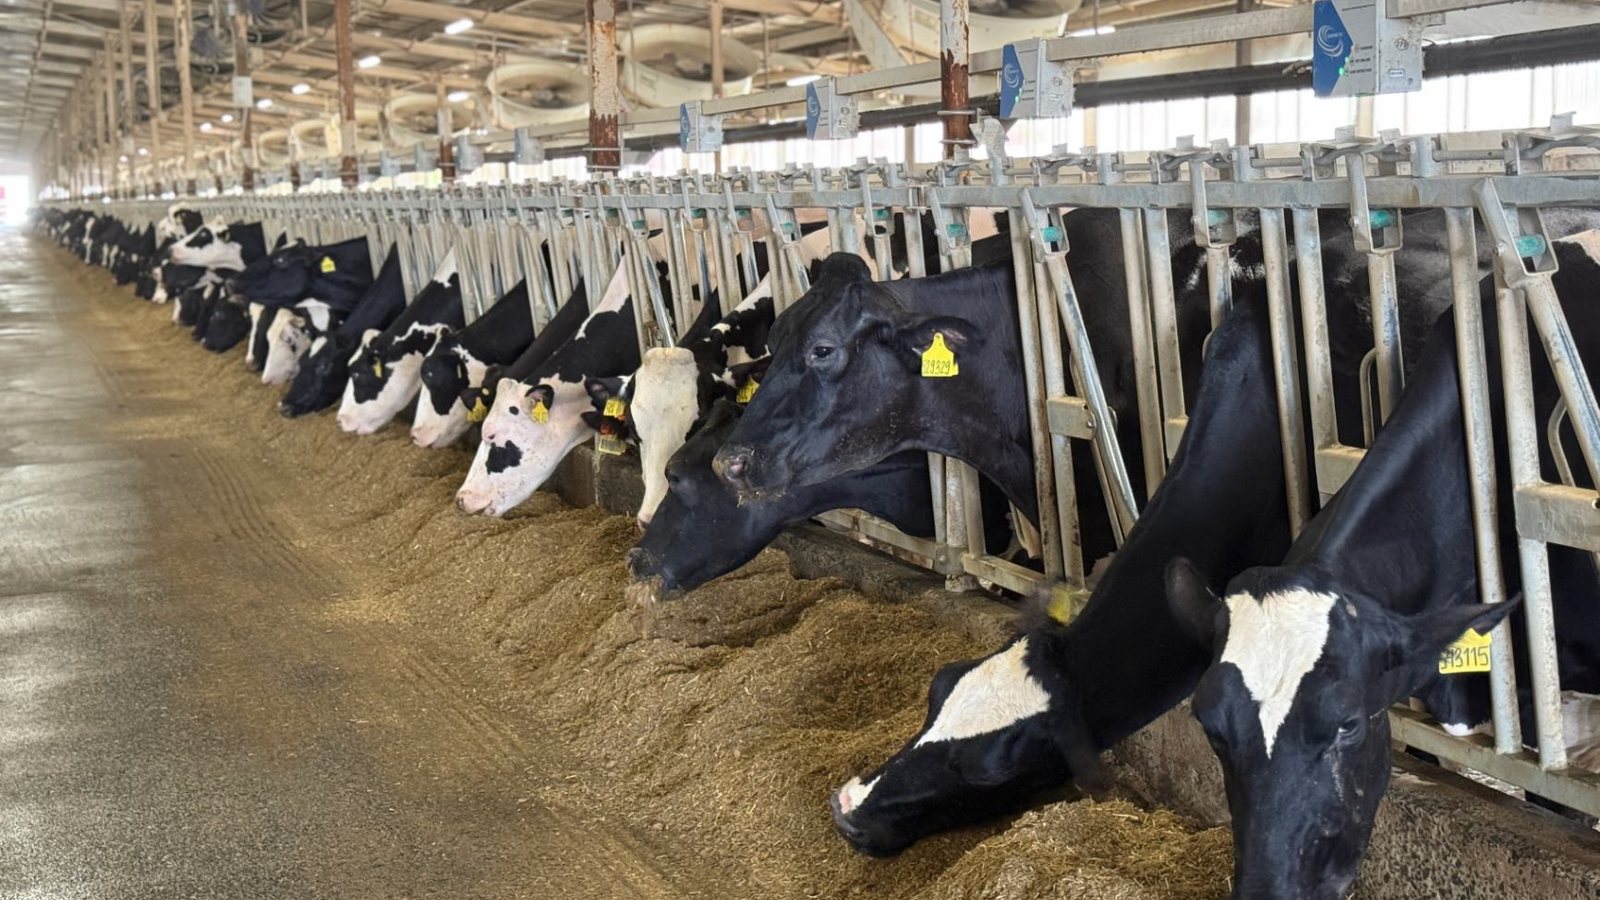
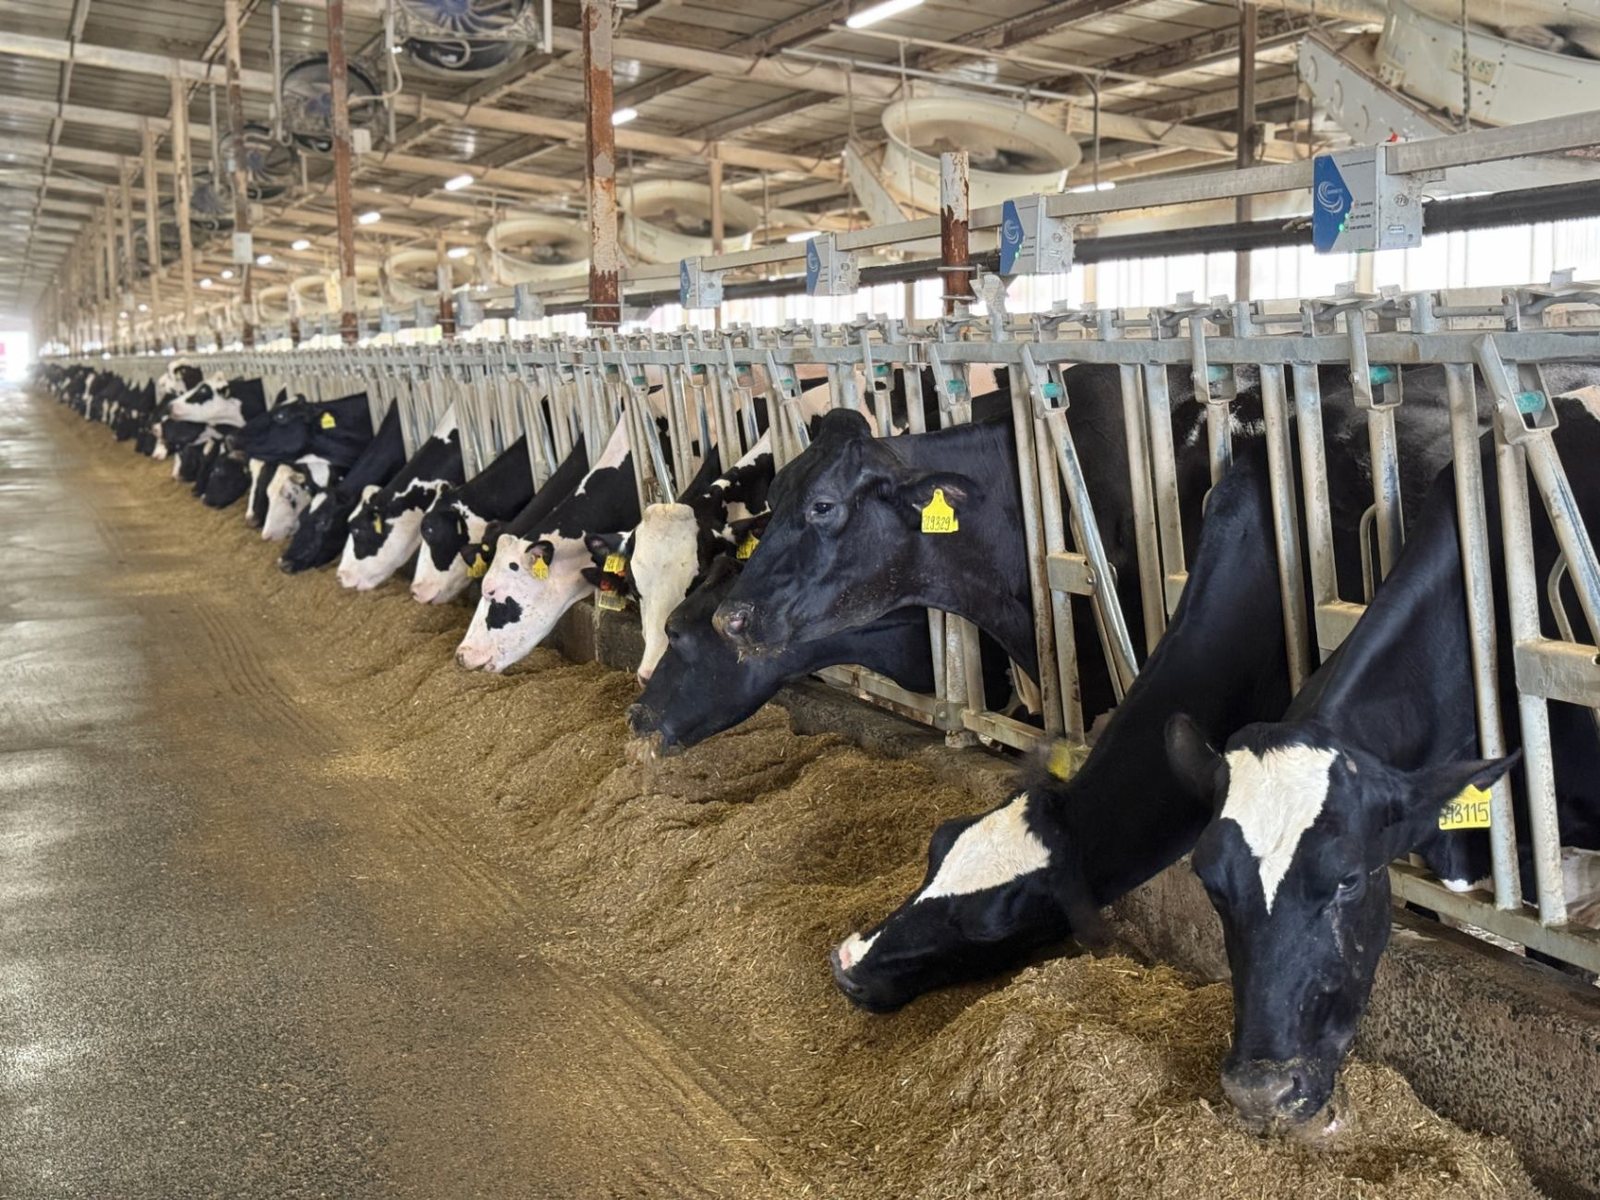
Delivery, push-up, intake, refusals and bunk shape per pen — the feed half of NutriTrack is in development. The part that ships today is the presence signal that lets FanPilot and TargetSoak act on where the cows actually are.
Vision-based control · Available nowFeed analytics · Coming soon
The vision presence signal is running in the field today and is what FanPilot and TargetSoak act on. Intake, refusal and bunk-shape analytics are in development with lead farms — the page below describes both, and each section says which is which.
The system
Two jobs, one camera line
What ships now. NutriTrack reads cow presence at the bunk from the PoE turret cameras and the models on the Mini-C Pro. That presence signal is what FanPilot uses to ventilate the cows in front of a fan, and what TargetSoak uses to soak where the herd is standing. It is available today and it is already in the field.
What is coming. The feed record itself — delivery and push-up events, intake, refusals and the shape of the bunk through the day, per pen group. The cameras and the controller are the same; the models and the analytics are in development with lead farms, and we would rather publish a date we can hold than a number we cannot.
Nothing is added to the feed wagon and nothing is entered by hand. The alley is observed, and the events are derived from what the cameras see — which is also why the two jobs share one hardware line rather than two.
What NutriTrack will not do is drive the feeder. It measures the bunk; the ration and the mixer stay under your control.
Feed comfort is the other half, and it sits outside the camera: a camera can measure how a cow eats, it cannot make the feed alley worth standing at. For how to choose and build a comfortable feeding setup — feed space per cow, barrier and neck-rail height, alley width and floor — and for what makes a cow-comfort feeding zone, the guidance starts at eastrock.cn, where East Rock keeps a library on exactly this.
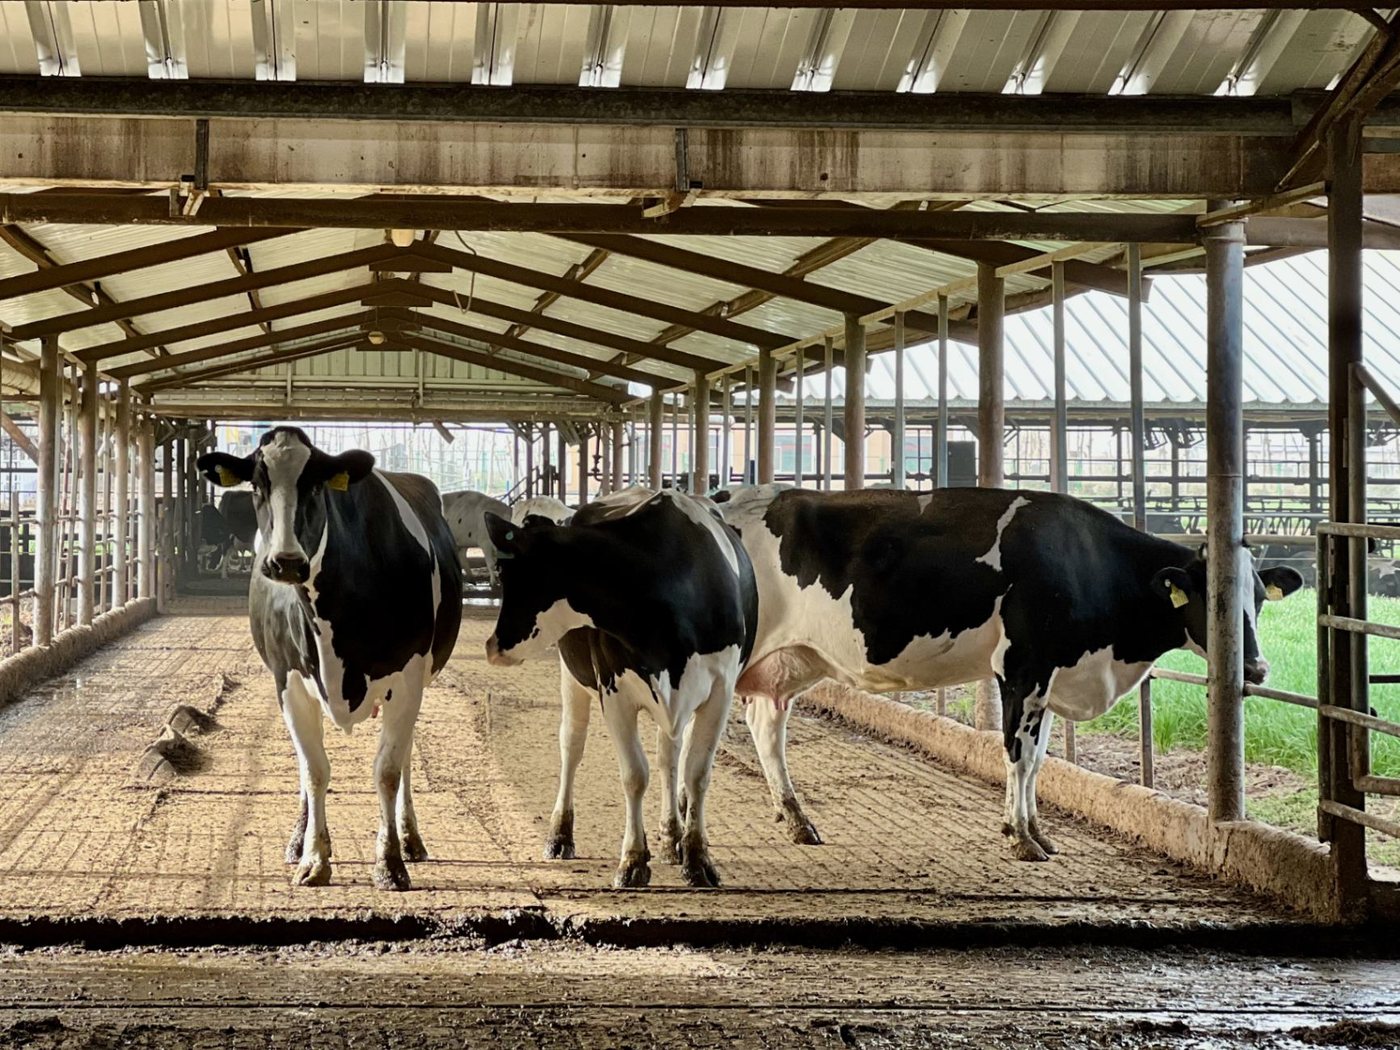
At the bunk. Presence is read today; delivery, push-up and intake are the analytics in development.
4 MPPoE turret cameras
Per penPresence today
ComingIntake and refusals
OptionalAdds to any grade
Equipment
What the system is made of
The same three pieces as the vision layer: the controller, the cameras and the edge box. The difference is where the cameras are pointed and what the models are asked for.
The controller the vision layers run on. A Mini-C Pro holds the models for lying time and feed intake, and hands the results to the FanPilot and TargetSoak controllers that act on them. It is a vision node, not a second control layer: the strategy stays where it was.
Runs the vision models on site
Serves LyingLogix and NutriTrack from one unit
Reports into the platform like the rest of the line
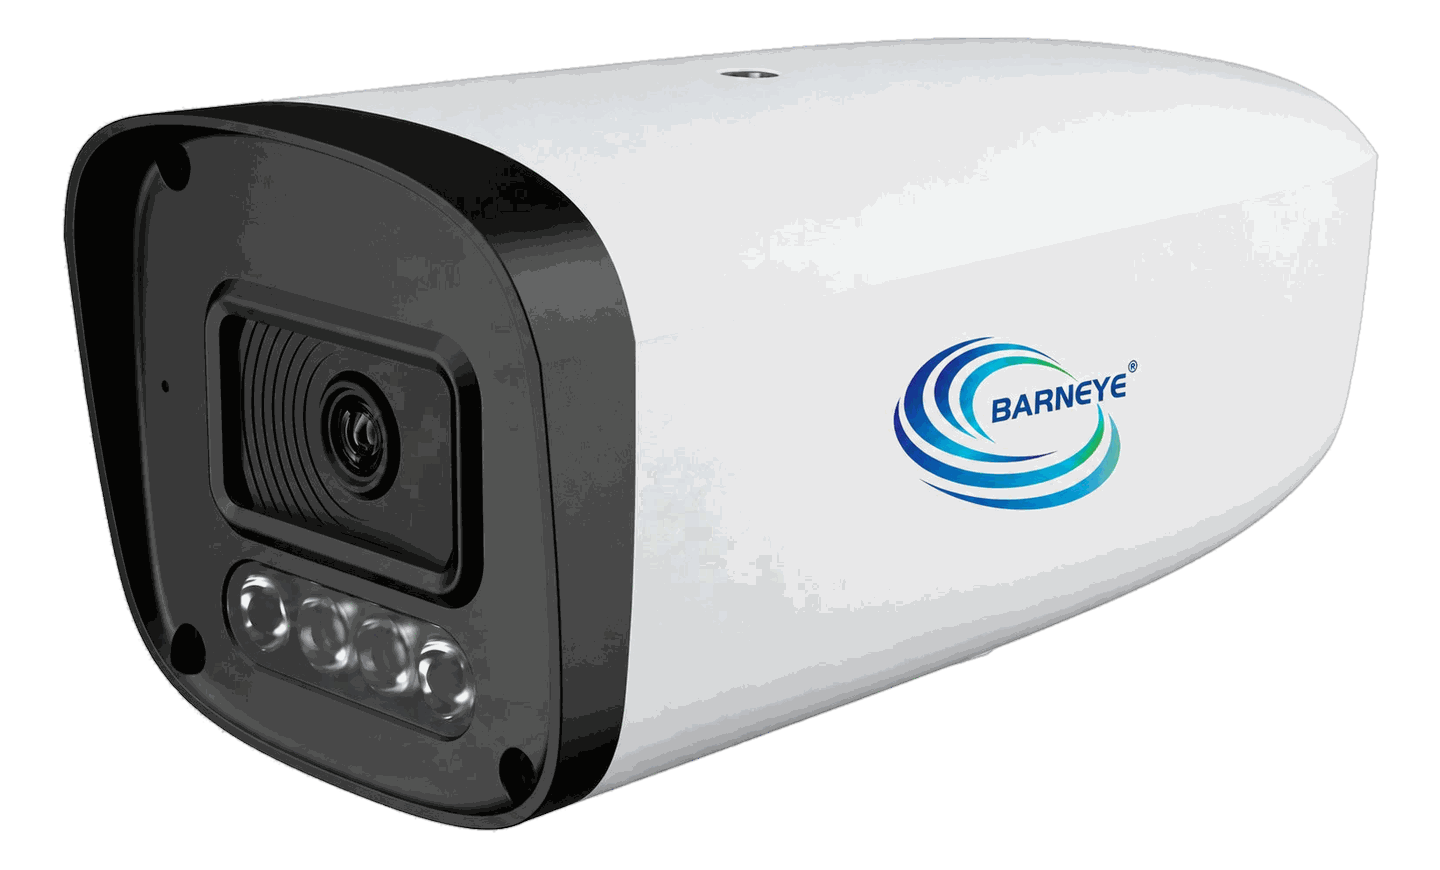
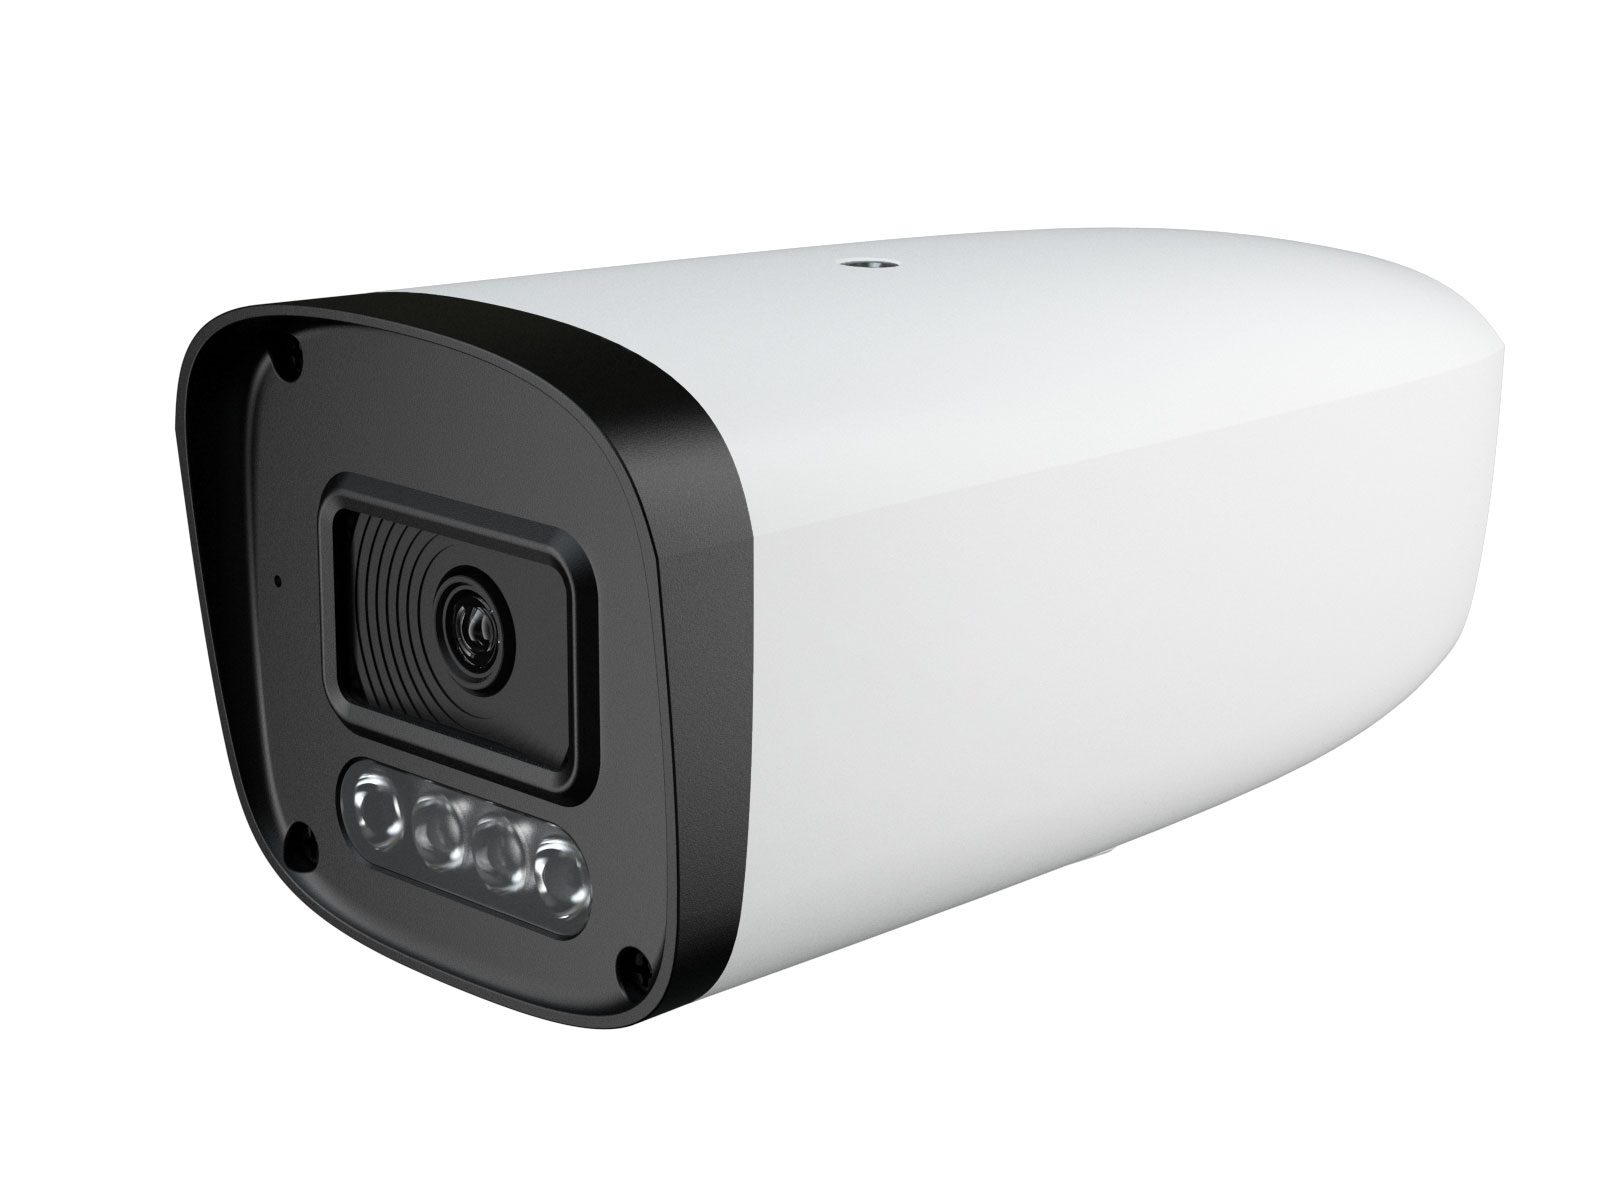
The 4 MP turret that looks down at the passage: one cable, H.265, NDAA. The same camera line covers the lying area and the feed alley, so a barn does not need a second camera system to be counted.
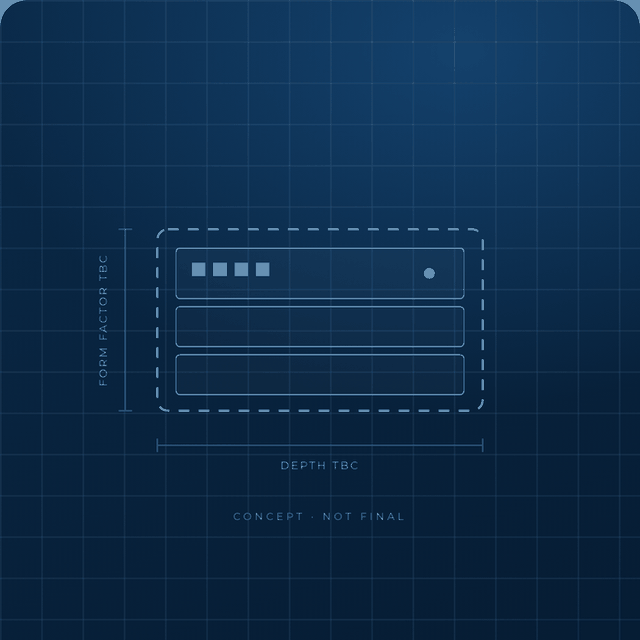
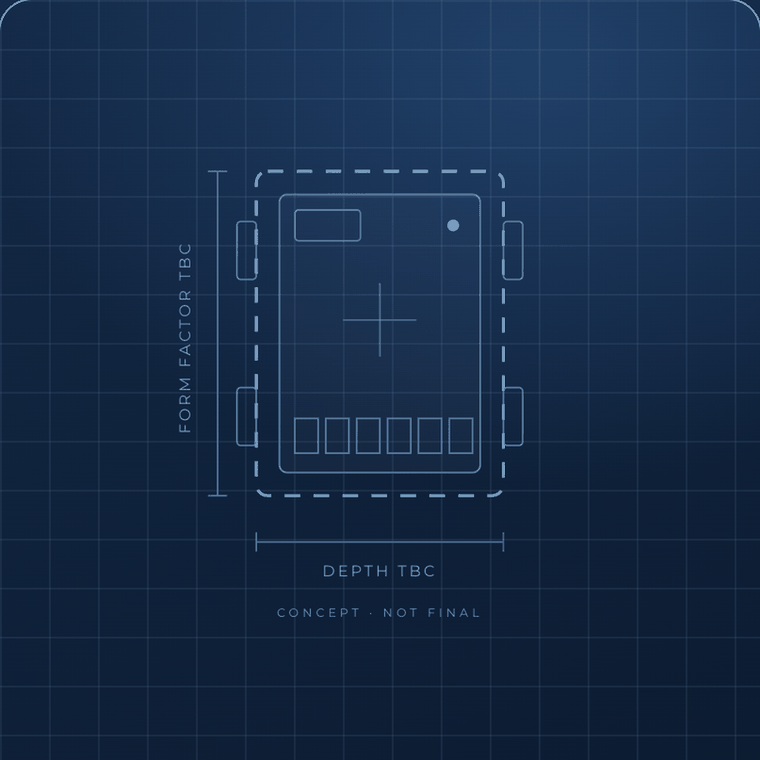
The edge enclosure that turns a camera stream into a count. Inference happens at the passage rather than in a data centre, so a dropped connection does not lose the count. Its form factor is still being confirmed.
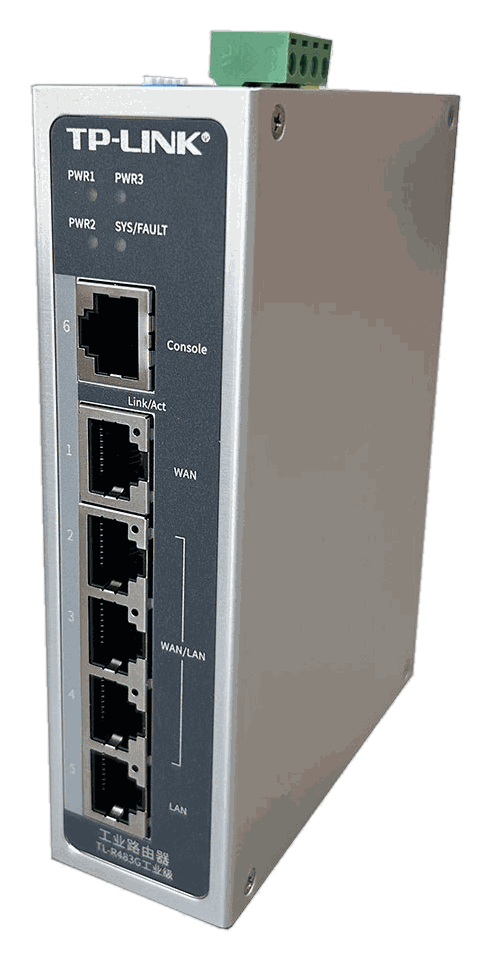
The uplink that puts the barn on the farm network. Multi-WAN and gigabit, on a DIN rail, so the platform can reach the controller and keep reaching it when one WAN drops. Without it the system still runs locally — it just stops being remote.
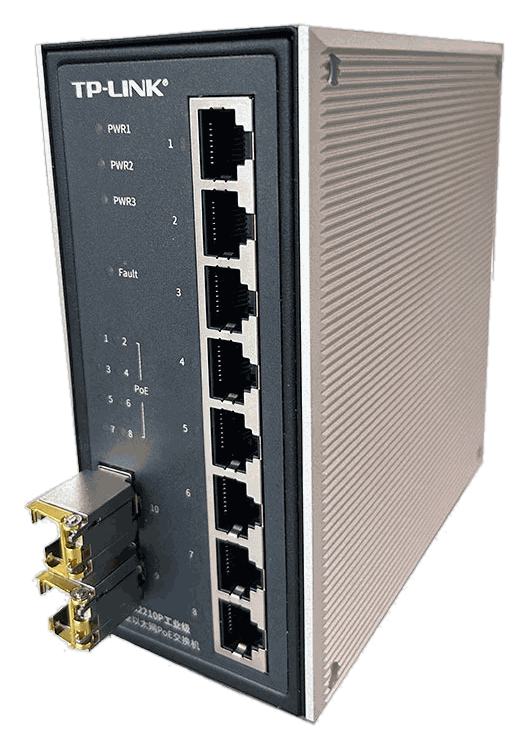
Ten ports in an industrial housing, eight of them PoE: the aggregation point for a camera run that outgrows the controller's own ports, with the power for the cameras on the same cable.
NutriTrack is an addition to a FanPilot or TargetSoak installation. The presence signal works today; the feed record arrives on top of it.
What it feeds todayThe cow-presence signal that FanPilot and TargetSoak act on — read at the bunk and along the pens, from the cameras already installed.
What it will recordDelivery and push-up events in the alley, intake, refusals and bunk shape, per pen group. In development with lead farms.
What it will leave behindA daily record per group — the basis for comparing rations, shifts and pen changes over weeks rather than from impressions.
Layout
Where NutriTrack looks
The same four-row barn as the vision layer, read at the other end of the cow day: the feed face along both central driveways rather than the lying area behind it.
Example layoutThis drawing is an example. Its basic conditions come from Live Barn and it is not an actual dairy barn — it shows how a layout is put together and must not be used as a configuration reference for any real project.Talk to us and we will prepare a solution for your barn
The same four-row barn, read at the bunk: 88 cameras, 8 PoE switches and 53 camera runs, resolving each pen group into eating time along the 5.5 m driveways.
1
Cameras — 88 units, 44 positionsThe same teal marks along both feed alleys, aimed at the bunk rather than across the cubicles. One camera system serves both readings.
2
Central feed driveways — 5.5 m eachDelivery and push-up travel these two alleys. Cameras looking down them are what make an event time-stamped rather than estimated.
3
Camera runs — 53Identical to the vision layer: 44 runs to the switches, four chained, four back to the controller. Nothing is rewired to add the feed reading.
4
One model, two outputsThe same recognition that builds the eating curve produces the presence signal used by ventilation and soaking. One camera system, one compute path.
Why NutriTrack
The bunk stops being a guess
Feed is the largest cost line on a dairy and the least observed one. These are the four things the feed record is being built to change — the first is shipping, the other three are the roadmap.
Delivery and push-up, recorded
When feed arrives and when it is pushed up become events rather than assumptions. The gap between them is usually where the ration is being lost. Coming soon.
Intake, refusals and bunk shape
How much is eaten, what is left, and how the bunk line changes through the day, per pen. A change shows up in the record before it shows up in production. Coming soon.
Analytics per group
Comparisons across pens, rations and weeks are held per group rather than averaged over the barn — which is what makes a change testable. Coming soon.
The presence signal, included today
The same camera line already supplies the cow-presence input that FanPilot and TargetSoak act on. That part is available now, and it is what the feed analytics will be built on.
Optional add-on · In developmentComing soon
The denominator for intake and refusals
The feed record will log what goes into the bunk, what is pushed up and what is left. Kilos per pen only become comparable once they are divided by the cows eating from it — and that group total moves every time a cow is dried off, moved or treated. HerdFlow is being built to supply that count from the passage camera, so intake and refusals can be reported per cow.
Per-pen head count supplied to the feed record
Intake and refusals expressed per cow, not per pen
Shares the camera line that already reads the bunk
The presence signal can be commissioned now. If you also want the feed record, send us the pen layout and the feeding schedule — we will tell you how many cameras the bunk line needs and when your site can join the analytics pilot.